
Windows 11 でパフォーマンスカウンターを使い、アプリのパフォーマンス測定をする手順
スタートメニューを開き、「パフォーマンスモニター」または「perfmon.msc」を検索し、選択します。
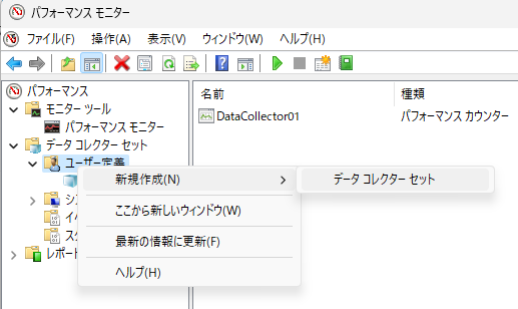
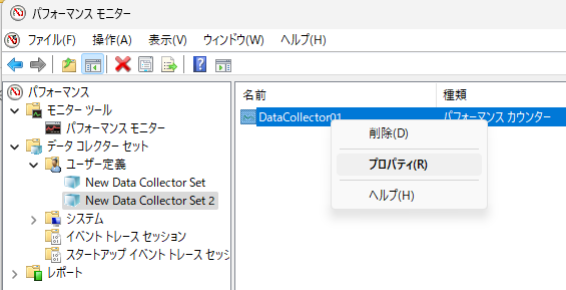
パフォーマンスモニターが開いたら、左側のツリービューで「データコレクターセット」 > 「ユーザー定義」を展開します。
右クリックして「新規作成」 > 「データコレクターセット」を選択します。
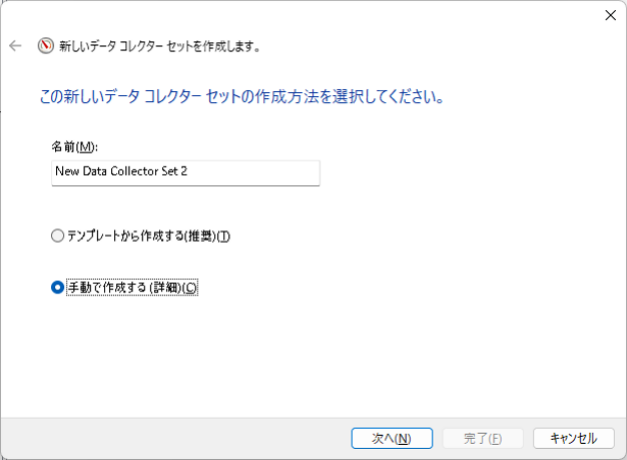
新しいデータコレクターセットの名前を入力し、「手動で作成する(詳細設定)」を選択します。
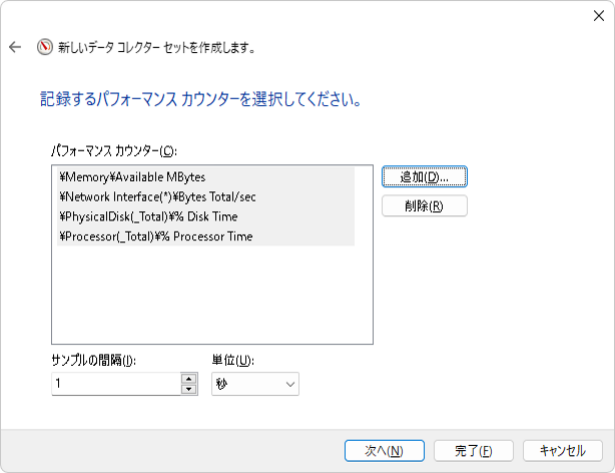
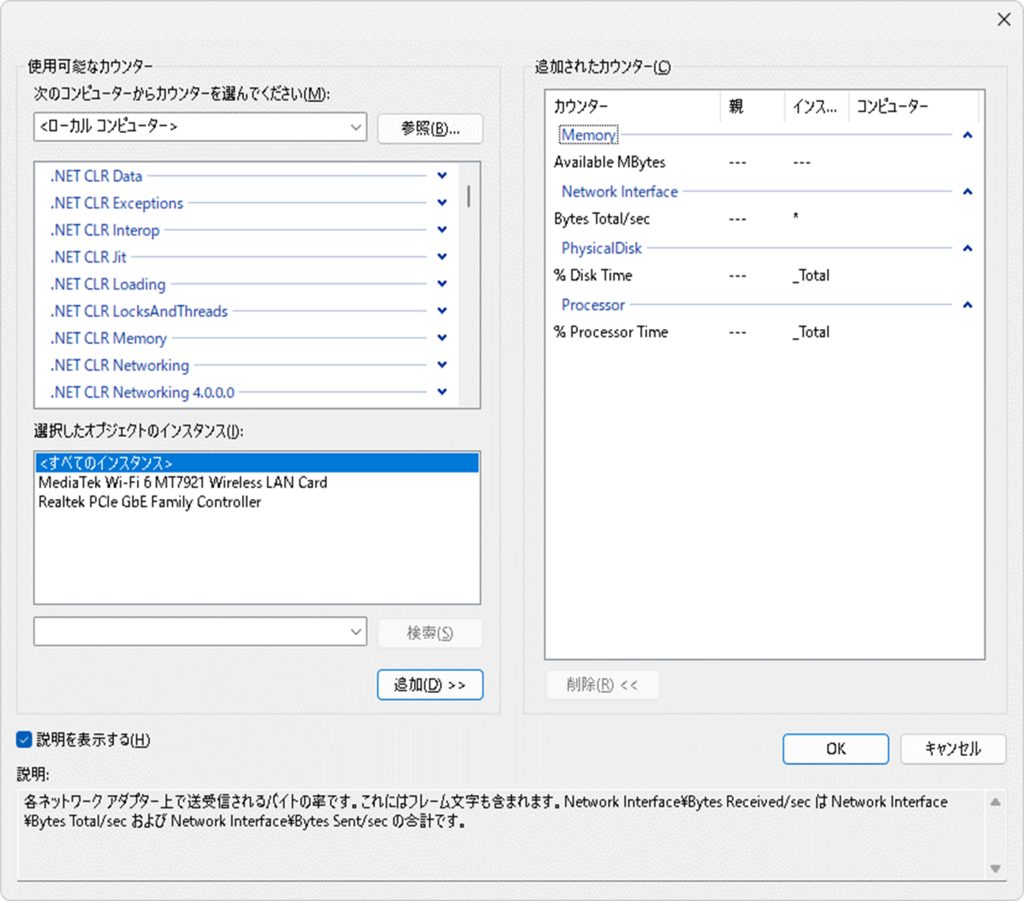
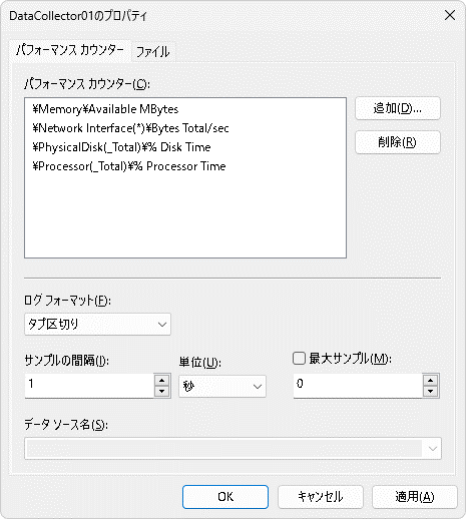
CPU、メモリ、ディスク、ネットワークそれぞれで全体(_Total)の負荷を記録。
|
1 2 3 4 5 6 |
\Memory Available MBytes \Network Interface(*)\Bytes Total/sec \PhysicalDisk(_Total)\% Disk Time \Processor(_Total)\% Processor Time |
ログフォーマットは「タブ区切り」に変更するとExcelで扱いやすい
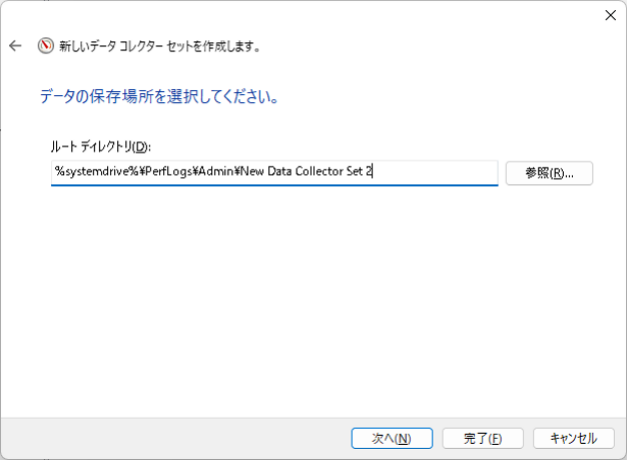
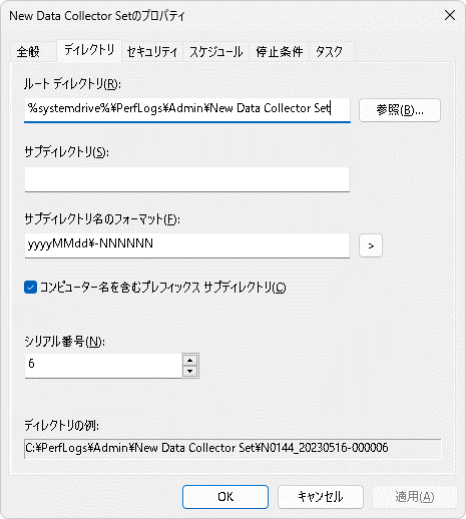
パフォーマンスカウンターログ出力先
%systemdrive%\PerfLogs\Admin\New Data Collector Set
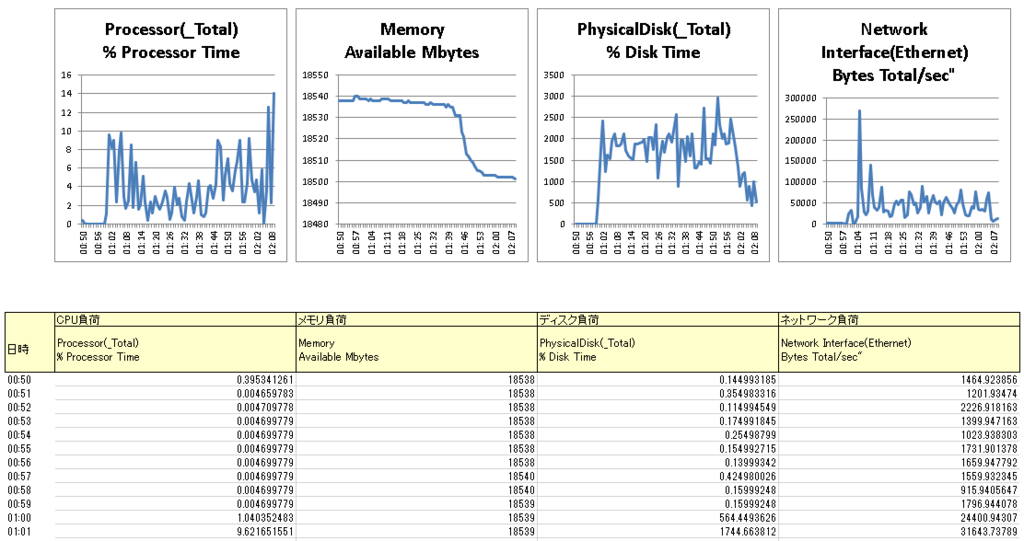
タブ区切りで出力されたパフォーマンスログをExcelに貼り、グラフ化した資料を作成した結果
コメント